You're watching the Thunder and the broadcast flashes a stat next to SGA: 34% usage. Your buddy nods like it's obvious. Most fans have no real idea what that number means. They just know bigger sounds better. It's one of the most useful stats in the game, and one of the most misread.
Here's usage rate in basketball, explained the way it should've been the first time you saw it. What it measures, how it's built, and how to actually use it when you're trying to read a box score before it happens.
What Usage Rate Actually Measures
Usage rate, written as USG%, estimates the share of his team's possessions a player finishes while he's on the floor. The key word is finishes. A possession ends in one of three ways for the player who closes it out. He takes a shot. He draws a trip to the free throw line. Or he coughs it up with a turnover.
Add those three things up and you get the possessions that player used. Usage rate is just that count, turned into a percentage of everything his team did while he played. It's a measure of how much the offense runs through one guy. Nothing about whether he's any good at it.
That last point trips people up, so sit with it. A 33% usage player is touching a third of his team's possessions. That could mean he's carrying them. It could also mean he's chucking them into the ground. The stat doesn't know the difference.
The Formula in Plain English
You don't need the full equation, but the logic is worth knowing. Take a player's shot attempts. Add about 0.44 of his free throw attempts, which estimates how many actual trips to the line he took, since two free throws usually come from one possession. Then add his turnovers. That total is his used possessions.
Divide that by the team's total possessions during his minutes, then scale it up to a percentage. The Basketball-Reference glossary lays out the exact math if you want to see it written out. The NBA.com stats glossary defines it the same way the league does officially.
The 0.44 factor is the only weird part. It exists because not every free throw closes a possession. Some come from and-ones, some from technical fouls. The fraction is a clean estimate that researchers settled on years ago.
Why 20 Percent Is the Magic Number
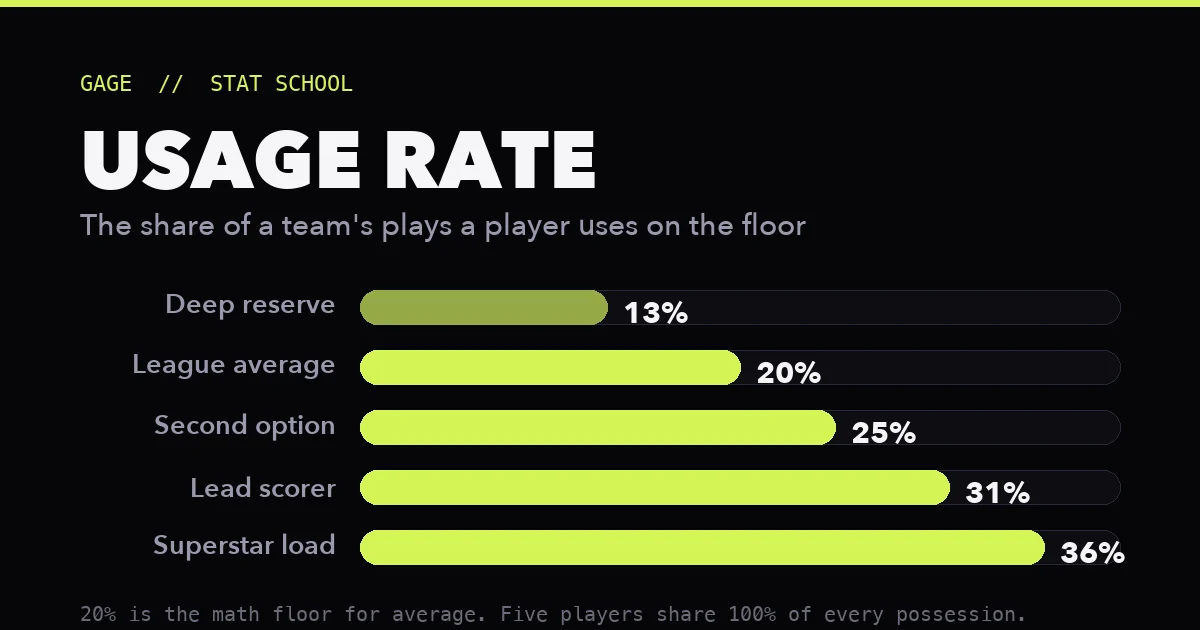
Five players share the floor. They split 100% of every possession between them. So the math floor for an average player is exactly 20%. That's not a coincidence. It's the whole reason 20 is the anchor you measure everyone against.
From there, the tiers are easy to picture:
- Role players usually land between 12% and 16%. Think a rim-running center or a wing whose job is to space the floor and defend.
- A team's second scoring option runs around 24% to 26%. Reliable, but not the engine.
- A clear number one option sits near 30%. The offense is built around him.
- The heaviest superstar loads push past 33%. Giannis, Luka, Embiid, and SGA all live up here in their biggest seasons.
The ceiling is wild when you see it. Russell Westbrook posted roughly 41.7% during his 2016-17 MVP season. That means he personally finished more than four of every ten possessions he was on the floor for. Almost no one else in history has touched that.
What Usage Rate Doesn't Tell You
This is where most fans go wrong. They treat high usage like a trophy. It isn't one. Usage is volume, full stop. Whether that volume helps the team is a separate question, and it's the more important one.
The fix is to pair usage with efficiency. True shooting percentage is the partner stat you want. It tells you how many points a player squeezes out of his chances. Put the two together and the picture snaps into focus. High usage plus high true shooting is a genuine star. High usage plus weak true shooting is a guy hurting his team while looking busy.
It's the same lesson as plus-minus. A single number that sounds like a verdict almost never is one. The fans who read the game well are the ones who know what each stat leaves out.
How Usage Rate Helps You Predict Player Stats
Here's where this gets practical. Usage is one of the cleanest tools you have for guessing what a box score will look like before tip-off, which is the whole game when you're trying to predict player stats against other fans.
The biggest edge comes from absence. Usage is a fixed pie. When a star sits with an injury or a rest night, the possessions he normally eats don't vanish. They get redistributed to whoever's left. A 14% role player can jump to 22% overnight when the number one option is out. His points, assists, and rebounds climb right along with it.
So the question to ask before any game isn't just who's playing. It's who absorbs the freed-up possessions. The backup point guard who suddenly runs the offense. The young wing who slides into the starting five. Those are the players whose totals spike, and most casual fans miss it because they're staring at the injury, not the opening it creates.
One trap to dodge: don't overreact to a single inflated game. A fill-in scorer who goes for 28 on huge usage while the star rests is not suddenly a 28-point player. The moment the star returns, the pie shrinks back. That's recency bias at work, and it wrecks more predictions than almost anything else. Treat the spike as a product of opportunity, not a permanent upgrade.
Common Questions
What is usage rate in basketball?
Usage rate, written as USG%, estimates the share of a team's possessions a player finishes while he is on the court. A possession counts as used when the player takes a shot, draws a trip to the free throw line, or commits a turnover. It measures how often the offense runs through one player, not how well he does with those chances.
What is a good usage rate in the NBA?
The league average sits right at 20% because five players share every possession. A role player usually lands between 12% and 16%. A team's second scoring option runs around 24% to 26%. A clear number one option lives near 30%, and the heaviest superstar loads push past 33%. High is not automatically good. It only tells you volume.
How is usage rate calculated?
Take a player's shot attempts, add about 0.44 of his free throw attempts to estimate trips to the line, then add his turnovers. That total is the possessions he used. Divide it by the team's total possessions during his minutes on the floor, then scale to a percentage. The 0.44 factor accounts for the fact that not every free throw ends a possession.
Does a high usage rate mean a player is good?
No. Usage rate measures volume, not quality. A player can finish 30% of his team's possessions and still hurt the offense if he scores inefficiently. To judge whether the volume is worth it, pair usage rate with true shooting percentage. High usage plus high efficiency is a star. High usage plus low efficiency is a problem.
Who has the highest usage rate in NBA history?
Russell Westbrook holds the record for a full qualifying season at roughly 41.7% during his 2016-17 MVP campaign, when he averaged a triple-double for the Oklahoma City Thunder. That figure is far above the normal superstar range and reflects how completely one player can dominate a team's offense.
Usage rate won't tell you who's good. It tells you who's getting the chances. Combine that with efficiency and a read on who's playing, and you can see a box score forming before the ball goes up. If you want to test those reads against other fans who care about the same details, GAGE is built for it. One game. Same stats for everyone. No house. Just your knowledge against theirs.